My middle daughter is five years old and is outgrowing her socks. As with most families, we have a resident sock ghoul who hides them and makes them disappear for weeks at a time, only to reappear in random locations – amongst the Goldfish cracker crumbs on the floor of the van, under couch cushions, or in the fireplace (yep).
So this week it was time to buy some new socks for her and I was reminded of how absolutely God-awful shoe and sock sizing is.
I don't buy enough socks or shoes to have committed the US size mapping to memory, so I needed to determine what size to look for.
This calls for mapping data to a lookup table. Mapping information takes something concrete the learner is familiar with (age of their daughter or size of foot in inches) and maps it to an abstract concept (US shoe size).
If you Google "shoe size chart" you'll find charts like this:

There are multiple paths through this chart to map the info I need.
- My daughter is 5yo so she fits under Kids 4-6 Years
- I can measure her foot to see exactly what size she maps to
For someone unfamiliar with the abstract mapping of US/UK shoe sizes, a chart like this is a godsend. Because otherwise, imagine trying to infer the mapping:
- 1Y – could be interpreted as "1 year old" (right????) – maps to size 13. 🤷♂️
- Size 13 – could be interpreted as 13" – maps to 7.5" 🤷♂️
- Size 0 – the only one that sort of makes sense as "newborn" or baby 👶
- UK Size 1/2 – wut 🤷♂️
- UK Size 1 – used twice, and maps to US size 2/2Y. 🤷♂️
Developers tend to get distracted by complex mapping when presenting information like this in tutorials or courses. They are excited because they know why it's like this. So they want to "explain" why – they find it interesting, so they assume viewers will find it interesting.
Except...
Your learners don't really care why the shoe size mapping is this way. You don't need to explain it, and they don't need to understand it unless that's the learning objective (e.g. Men's Shoe Sizes Make NO Sense – Here's Why).
All they care about is: WTF sock size do I get?
The chart above is excellent because it goes a step further and groups the data on the left side into much more familiar attribution: age (0-2 months, 7-13 years), size of kid (Small Kids/Big Kids), with natural terminology (Youth, Toddler, Infant).
In other words, it's focused on the learner's context – it's human-centric.
I found the chart above on Pinterest. Really good lookup charts are not only educational, they can be repurposed for marketing and valuable to your audience.
Now, I just showed you a good example. What does a bad example look like?
This is what I see for the manufacturer's "size chart" on the girl's socks I was looking at:
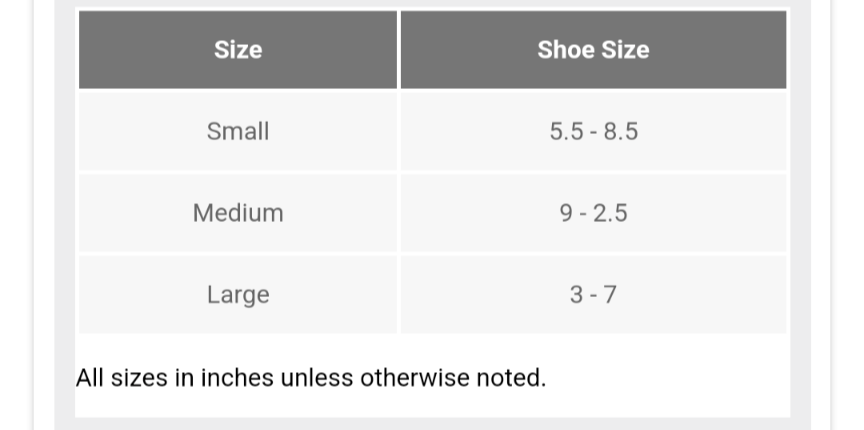
Please send me everything wrong with this picture.
Have a lovely day,
Kamran